Objective and Strategy: The portfolio aims to achieve returns in excess of UK CPI + 3% p.a. over rolling three year periods. Over any three year rolling period the portfolio should always deliver a positive return. Portfolio returns will be generated through interest income, dividend income and capital growth. The portfolio benchmark is the EAA Fund GBP Cautious Allocation category. The portfolio is a multi-manager portfolio ideally comprising at least two underlying funds and not more than six. Fund selection will be bias towards high Sortino ratios, low downside standard deviation and to managers and funds that have successfully navigated sustained negative market conditions. Where possible underlying funds will be given as many of the asset allocation decisions as possible. Underlying investments will be held in multiple first world currencies, however, all performance and risk statistics will be in GBP.
Investment Objective and Strategy
Download Fund factsheet
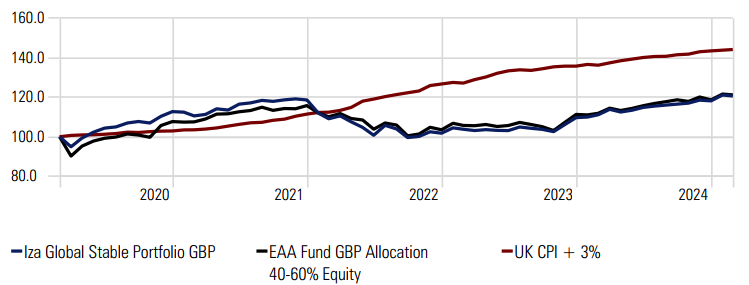
Cumulative Growth Since Inception (GBP)
Trailing Returns (GBP)

Risk Measures
| Risk Metrics | IZA Global Stable Model Portfolio |
Benchmark |
|---|---|---|
| Standard Deviation* | 6.64 | 6.83 |
| Sharpe Ratio* | 1.03 | 0.52 |
| Sortino Ratio* | 0.66 | 0.29 |
*Annualised
Periodic Returns (GBP)
| Period | Iza Global Stable Portfolio GBP | EAA Fund GBP Allocation 40-60% Equity |
|---|---|---|
| 1 Month | -0.41 | -0.34 |
| 3 Months | 1.78 | 0.90 |
| 6 Months | 3.98 | 2.92 |
| YTD | 2.10 | 2.12 |
| 1 Year | 8.58 | 8.35 |
| 3 Years | 3.42 | 3.25 |
| 5 Years | 3.83 | 3.93 |
Asset Allocation
Monthly Portfolio Net Returns (GBP)
| Jan | Feb | Mar | Apr | May | Jun | Jul | Aug | Sep | Oct | Nov | Dec | YTD | B-Mark | — | |
|---|---|---|---|---|---|---|---|---|---|---|---|---|---|---|---|
| 2025 | 2.53 | -0.41 | 2.10 | 2.12 | — | ||||||||||
| 2024 | 0.24 | 1.00 | 2.44 | -1.26 | 0.89 | 1.25 | 0.59 | 0.44 | 0.41 | 0.45 | 1.29 | -0.32 | 7.76 | 6.65 | — |
| 2023 | 2.77 | -0.76 | -0.53 | 0.51 | -0.46 | 0.01 | 1.80 | -0.74 | -0.72 | -1.17 | 3.64 | 3.37 | 7.76 | — | — |
| 2022 | -5.71 | -2.58 | 1.21 | -2.98 | -2.63 | -4.04 | 4.97 | -1.97 | -4.41 | 0.73 | 2.51 | -0.65 | -14.96 | -10.62 | 13.71 |
| 2021 | -0.25 | -1.64 | 0.58 | 2.53 | -0.45 | 1.90 | 0.55 | 1.00 | -0.50 | 0.70 | 0.20 | -0.38 | 4.25 | 2.34 | 8.30 |
| 2020 | 0.58 | -3.22 | -5.41 | 4.99 | 2.65 | 1.52 | 0.84 | 1.96 | 0.49 | -0.74 | 3.30 | 2.24 | 9.11 | 4.09 | 3.59 |
| 2019 | 2.5 | 1.7 | 2.4 | 1.3 | -0.6 | 2.2 | 2.27 | -0.67 | -0.66 | -0.73 | 1.15 | 0.25 | 11.59 | 8.34 | 4.30 |
| 2018 | 0.1 | -0.5 | -1.6 | 1.4 | 1.7 | 0.6 | 1.3 | 0.8 | -0.6 | -2.7 | 0.4 | -3.1 | -2.4 | -2.75 | 5.10 |
Commentary
Financial markets kicked off 2025 with notable shifts, driven by geopolitical factors, inflation concerns, and a shake-up in the global AI landscape. U.S. equities posted mixed results, as gains were concentrated in a few large-cap sectors while other regions, including Europe and select emerging markets, outperformed. Meanwhile, bond markets saw volatility amid ongoing policy adjustments, and commodities delivered robust returns fuelled by geopolitical risks and seasonal demand.
In the equity space, Europe and UK stole the spotlight with the MSCI Europe ex-UK Index up 7.1% for the month, outpacing the S&P 500’s more modest 2.8% gain. European markets were supported by improving macroeconomic data, including retail sales growth of 1.2% year-on-year and a composite Purchasing Managers’ Index (PMI) moving into expansion territory at 50.2. Analysts raised earnings estimates after a strong Q4 2024 earnings season, particularly in the financials and consumer discretionary sectors. The region’s outperformance was further bolstered by its low exposure to the struggling technology sector.
The U.S. market, while positive overall, revealed areas of vulnerability. The Magnificent Seven tech giants, which had been the primary drivers of U.S. equity performance over the past two years, faced new competition. DeepSeek, a Chinese AI firm, unveiled low-cost, efficient AI models that directly challenged Nvidia’s dominance. Nvidia suffered a historic $600 billion market cap decline on January 27, marking the largest single-day loss in U.S. stock market history and dragging the tech-heavy Nasdaq to just a 0.7% monthly gain. However, the broader market found support from President Trump’s promise of tax cuts, deregulation, and infrastructure spending, which lifted sentiment across consumer discretionary and financial sectors.
Bond markets experienced heightened volatility as global yields initially climbed on expectations of inflationary pressure stemming from Trump’s proposed policies. U.S. 10-year Treasury yields rose by 20 basis points early in January but reversed course after a weaker-than-expected December inflation report and the AIdriven tech sell-off. U.S. Treasuries ended the month with a 0.5% gain.
Returns are based on the strategic underlying weightings of the funds and will not exactly reflect individual client returns. All returns are net of fund management fees, but exclude advice and administration fees. Prior to portfolio launch date, the performance is pro-forma using the actual underlying fund performances and is net of all fees and expenses.
*The performance information is based on the back-tested performance of hypothetical investments over the time periods indicated. “Back-testing” is a process of objec-tively simulating historical investment returns by applying a set of rules for buying and selling securities, and other assets, backward in time, testing those rules, and hypo-thetically investing in the securities and other assets that are chosen. Back-testing is designed to allow investors to understand and evaluate certain strategies by seeing how they would have performed hypothetically during certain time periods. While back-testing results reflect rigorous application of the investment strategy selected, back-tested results have certain limitations and should not be considered indica-tive of future results. The results achieved in our simulations do not guarantee future investment results.
Sign up to our newsletter!
Keep updated on how best to create wealth and protect it for the future.