The principal investment objective of the Fund is to achieve medium to long term capital appreciation at the risk of moderate short-term volatility of capital values. The Fund is Diversified CIS designed to maximise returns. It will be diversified across asset classes and regions. The investment objective is to achieve medium to long term capital growth through exposure to selected sectors of the global equity market, bond market, and money market. The Fund is aimed at investors with a medium to long term (4 to 6 years) investment time horizon. This Fund is best suited for investors who can accept some volatile capital movements but seek consistent returns.
Investment Objective and Strategy
Download Fund factsheet
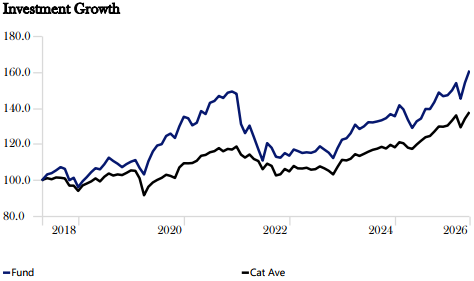
Cumulative Growth Since Inception (GBP)
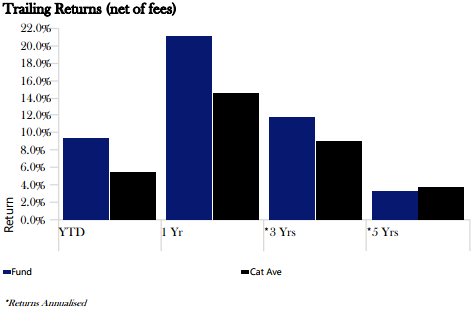
Trailing Returns (GBP)
Risk Measures
| Risk Metrics | Fund* | Cat Ave |
|---|---|---|
| Standard Deviation* | 11.1 | 7.8 |
| Sharpe Ratio* | 0.4 | 0.2 |
| Sortino Ratio* | 0.7 | 0.3 |
*Annualised
Periodic Returns (GBP)
| Period | Fund | Cat Ave |
|---|---|---|
| 1 Month | 4.4 | 2.7 |
| 3 Months | 4.5 | 1.1 |
| 6 Months | 9.7 | 6.0 |
| YTD | 9.3 | 5.5 |
| 1 Year | 21.2 | 14.5 |
| 3 Years | 11.7 | 9.0 |
| 5 Years | 3.3 | 3.8 |
| Since Inception | 6.0 | 4.0 |
Asset Allocation
Top 10 Equities
| Weight % | |
|---|---|
| Gold |
3.6 |
| BNP Paribas Issuance BV |
2.5 |
| Taiwan Semiconductor Manufacturing Co Ltd |
2.1 |
| NVIDIA Corp |
1.9 |
| SpaceX |
1.5 |
| J.P. Morgan Structured Products B.V. |
1.4 |
| Apple Inc |
1.4 |
| Microsoft Corp |
1.3 |
| Amazon.com Inc |
1.2 |
| Canadian Imperial Bank of Commerce |
1.2 |
Equity Sectors
| Equity Econ Sector | % |
|---|---|
| Financial Services |
15.0 |
| Healthcare |
10.6 |
| Technology |
27.6 |
| Consumer Cyclical |
11.9 |
| Consumer Defensive |
5.2 |
| Communication Services |
8.6 |
| Industrials |
12.6 |
| Energy |
2.8 |
| Basic Materials |
3.1 |
| Utilities |
1.2 |
| Real Estate |
1.4 |
Monthly Portfolio Net Returns (GBP)
| Jan | Feb | Mar | Apr | May | Jun | Jul | Aug | Sep | Oct | Nov | Dec | YTD | B-Mark | — | |
|---|---|---|---|---|---|---|---|---|---|---|---|---|---|---|---|
| 2026 | 1.9 | 2.7 | -5.6 | 6.1 | 4.4 | 9.3 | 5.5 | — | |||||||
| 2025 | 4.5 | -1.6 | -4.1 | -3.4 | 2.8 | 1.2 | 3.9 | -0.1 | 2.8 | 3.7 | -1.4 | 0.4 | 8.6 | 10.1 | — |
| 2024 | 0.63 | 2.28 | 3.78 | -1.86 | 1.14 | 1.77 | -0.1 | 0.4 | 0.5 | 0.9 | 1.7 | -0.9 | 10.6 | 6.2 | — |
| 2023 | 3.02 | -0.72 | -0.94 | 0.33 | -0.27 | 0.75 | 2.37 | -1.52 | -1.46 | -2.61 | 4.88 | 3.99 | 7.79 | 5.93 | — |
| 2022 | -11.35 | -3.83 | 3.33 | -4.88 | -5.47 | -5.33 | 8.71 | -2.14 | -4.21 | -0.48 | 2.28 | -1.24 | -23.17 | -11.52 | 16.32 |
| 2021 | -0.63 | -2.91 | 1.10 | 4.92 | -1.23 | 4.57 | 0.71 | 1.93 | -0.77 | 2.02 | 0.44 | -0.84 | 9.41 | 8.58 | 10.51 |
| 2020 | 0.84 | -3.92 | -3.37 | 7.05 | 4.94 | 2.84 | 0.60 | 3.80 | 1.06 | -1.93 | 5.18 | 4.12 | 22.57 | 4.09 | 5.59 |
| 2019 | 3.38 | 2.25 | 2.72 | 2.12 | -0.60 | 2.66 | 3.36 | -1.66 | -1.35 | -1.76 | 1.58 | 1.22 | 14.60 | 11.96 | 6.30 |
| 2018 | 0.58 | -0.41 | -2.78 | 3.5 | 2.77 | 0.63 | 1.49 | 1.70 | -0.89 | -5.92 | 1.38 | -5.12 | -3.51 | -7.32 | 7.10 |
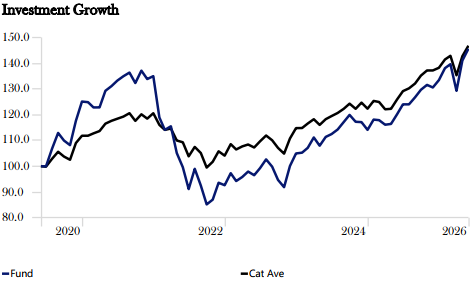
Cumulative Growth Since Inception (USD)
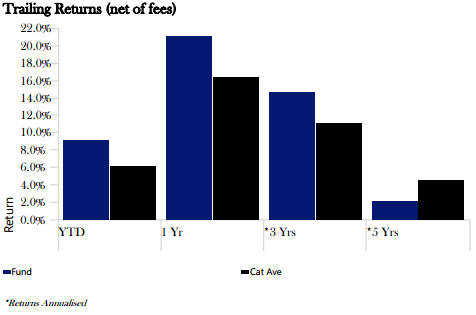
Trailing Returns (USD)
Risk Measures
| Risk Metrics | Fund* | Cat Ave |
|---|---|---|
| Standard Deviation* | 15.0 | 8.6 |
| Sharpe Ratio* | 0.1 | 0.1 |
| Sortino Ratio* | 0.3 | 0.3 |
*Annualised
Periodic Returns (USD)
| Period | Fund | Cat Ave |
|---|---|---|
| 1 Month | 3.3 | 2.8 |
| 3 Months | 4.3 | 2.6 |
| 6 Months | 11.5 | 7.0 |
| YTD | 9.1 | 6.1 |
| 1 Year | 21.2 | 16.4 |
| 3 Years | 14.7 | 11.0 |
| 5 Years | 2.1 | 4.5 |
| Since Inception | 6.6 | 6.8 |
Top 10 Equities
| Weight % | |
|---|---|
| Gold |
3.6 |
| BNP Paribas Issuance BV |
2.5 |
| Taiwan Semiconductor Manufacturing Co Ltd |
2.1 |
| NVIDIA Corp |
1.9 |
| SpaceX |
1.5 |
| J.P. Morgan Structured Products B.V. |
1.4 |
| Apple Inc |
1.4 |
| Microsoft Corp |
1.3 |
| Amazon.com Inc |
1.2 |
| Canadian Imperial Bank of Commerce |
1.2 |
Equity Sectors
| Equity Econ Sector | % |
|---|---|
| Financial Services |
15.0 |
| Healthcare |
10.6 |
| Technology |
27.6 |
| Consumer Cyclical |
11.9 |
| Consumer Defensive |
5.2 |
| Communication Services |
8.6 |
| Industrials |
12.6 |
| Energy |
2.8 |
| Basic Materials |
3.1 |
| Utilities |
1.2 |
| Real Estate |
1.4 |
Asset Allocation
Monthly Portfolio Net Returns (USD)
| Jan | Feb | Mar | Apr | May | Jun | Jul | Aug | Sep | Oct | Nov | Dec | YTD | B-Mark | — | |
|---|---|---|---|---|---|---|---|---|---|---|---|---|---|---|---|
| 2026 | 3.5 | 1.1 | -7.4 | 9.1 | 3.3 | 9.1 | 6.1 | — | |||||||
| 2025 | 3.5 | -0.2 | -1.5 | 0.3 | 3.2 | 3.2 | 0.0 | 2.2 | 2.3 | 1.5 | -0.8 | 2.2 | 16.9 | 13.0 | — |
| 2024 | 0.29 | 1.77 | 3.78 | -2.89 | 3.17 | 1.0 | 1.6 | 2.5 | 2.4 | -2.2 | -0.1 | -2.6 | 8.7 | 6.7 | — |
| 2023 | 5.04 | -3.13 | 1.66 | 2.21 | -1.45 | 2.85 | 3.44 | -2.77 | -5.15 | -2.98 | 8.95 | 4.87 | 13.32 | 10.22 | — |
| 2022 | -11.89 | -4.05 | 1.23 | -8.99 | -5.25 | -8.51 | -8.63 | -6.55 | -7.94 | 2.19 | 7.54 | -1.04 | -31.38 | -13.47 | 12.45 |
| 2021 | -0.18 | -1.64 | 0.02 | 5.25 | 1.40 | 1.64 | 1.27 | 1.05 | -2.98 | 3.64 | -2.39 | 0.85 | 7.90 | 7.76 | 12.13 |
| 2020 | 0.34 | -6.90 | -6.20 | 8.89 | 2.85 | 2.78 | 6.87 | 5.75 | -2.62 | -1.62 | 8.73 | 6.36 | 26.30 | 6.87 | 6.30 |
| 2019 | 6.78 | 3.39 | 0.63 | 2.17 | -3.90 | 3.67 | -0.55 | -2.19 | -0.18 | 3.15 | 1.54 | 3.66 | 19.21 | 13.46 | 7.26 |
| 2018 | 5.73 | -3.50 | -1.02 | 1.62 | -0.71 | -0.16 | -.83 | 0.77 | -0.56 | -7.82 | 1.23 | -5.29 | -9.16 | -7.98 | 6.92 |
Historical returns are taken from actual segregated portfolio returns prior to the inception of the fund in April 2018
*The performance information is based on the back-tested performance of hypothetical investments over the time periods indicated. “Back-testing” is a process of objec-tively simulating historical investment returns by applying a set of rules for buying and selling securities, and other assets, backward in time, testing those rules, and hypo-thetically investing in the securities and other assets that are chosen. Back-testing is designed to allow investors to understand and evaluate certain strategies by seeing how they would have performed hypothetically during certain time periods. While back-testing results reflect rigorous application of the investment strategy selected, back-tested results have certain limitations and should not be considered indica-tive of future results. The results achieved in our simulations do not guarantee future investment results.
Download Fund factsheet
Sign up to our newsletter!
Keep updated on how best to create wealth and protect it for the future.