Objective and Strategy: The portfolio aims to achieve returns in excess of UK CPI + 7% p.a. over rolling six year periods. Over any three year rolling period the portfolio should always deliver a positive return. Portfolio returns will be generated through interest income, dividend income and capital growth. The portfolio benchmark is the MSCI ACWI. The portfolio is a multi-manager portfolio ideally comprising at least two underlying funds and not more than six. Fund selection will be bias towards high Sortino ratios, low downside standard deviation and to managers and funds that have successfully navigated sustained negative market conditions. Where possible underlying funds will be given as many of the asset allocation decisions as possible. Underlying investments will be held in multiple first world currencies, however, all performance and risk statistics will be in GBP.
Investment Objective and Strategy
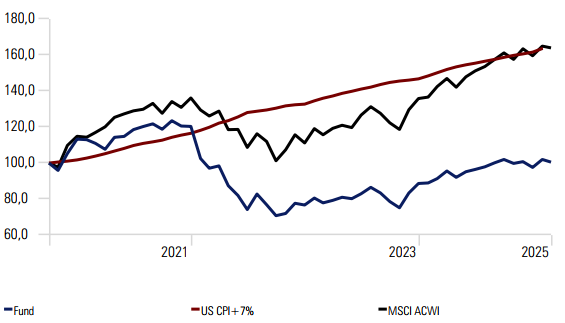
Cumulative Growth Since Inception (GBP)

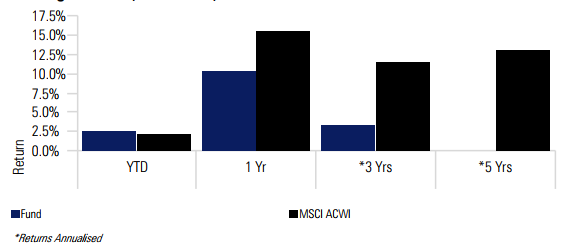
Trailing Returns (GBP)
Risk Measures
| Risk Metrics | Fund | MSCI ACWI |
|---|---|---|
| Standard Deviation* | 14.9 | 10.9 |
| Sharpe Ratio* | -0.1 | 0.9 |
| Sortino Ratio* | 0.0 | 1.1 |
*Annualised
Periodic Return (GBP)
| Period | Fund | MSCI ACWI |
|---|---|---|
| 1 Month | -2.9 | -1.9 |
| 3 Months | 1.0 | 1.3 |
| 6 Months | 4.8 | 8.6 |
| YTD | 2.5 | 2.2 |
| 1 Year | 10.4 | 15.6 |
| 3 Years | 3.4 | 11.5 |
| 5 Years | — | 13.1 |
| Since Inception | 2.5 | 13.4 |
Asset Allocation
Equity Exposure
| % | |
|---|---|
| Berkshire Hathaway Inc Class B |
5.7 |
| Opus – Chartered Issuances SA 0% PERP |
5.2 |
| Amazon.com Inc |
2.9 |
| Microsoft Corp |
2.7 |
| Taiwan Semiconductor Manufacturing Co Ltd |
1.9 |
| Apple Inc |
1.9 |
| Alphabet Inc Class A |
1.7 |
| NVIDIA Corp |
1.3 |
| Meta Platforms Inc Class A |
1.3 |
| Mastercard Inc Class A |
1.1 |
Top 10 Holdings
| % | |
|---|---|
| Financial Services |
20.0 |
| Healthcare | 13.3 |
| Technology |
21.6 |
| Consumer Cyclical |
11.4 |
| Consumer Defensive |
6.1 |
| Communication Services |
6.9 |
| Industrials |
10.0 |
| Energy |
2.4 |
| Basic Materials |
1.8 |
| Utilities |
0.6 |
| Real Estate |
5.9 |
Monthly Portfolio Net Returns (GBP)
| Jan | Feb | Mar | Apr | May | Jun | Jul | Aug | Sep | Oct | Nov | Dec | YTD | B-Mark | — | |
|---|---|---|---|---|---|---|---|---|---|---|---|---|---|---|---|
| 2025 | 5.5 | -2.9 | 2.5 | 2.2 | — | ||||||||||
| 2024 | 0.66 | 3.22 | 4.65 | -2.69 | 1.36 | 2.1 | -0.2 | 0.2 | 0.0 | 1.0 | 2.8 | -1.5 | 11.9 | 19.6 | — |
| 2023 | 3.03 | -0.93 | -0.80 | 0.27 | 0.06 | 1.30 | 3.20 | -2.37 | -2.06 | -4.06 | 6.82 | 5.45 | 9.74 | 16.81 | — |
| 2022 | -14.28 | -5.06 | 3.45 | -7.17 | -6.40 | -6.41 | 11.71 | -2.82 | -4.15 | -0.93 | 2.59 | -1.45 | -28.65 | -7.83 | 18.54 |
| 2021 | -0.78 | -3.28 | 0.92 | 6.04 | -2.17 | 6.27 | 0.74 | 2.21 | -0.35 | 2.34 | 0.48 | -1.86 | 10.56 | 23.12 | 20.46 |
| 2020 | 0.94 | -5.79 | -1.49 | 10.21 | 7.51 | 4.97 | 1.57 | 5.60 | 1.60 | -3.45 | 6.38 | 5.39 | 37.44 | 12.32 | 7.59 |
| 2019 | 3.6 | 2.6 | 3.6 | 2.9 | -0.9 | 3.2 | 4.61 | -2.09 | -2.43 | -2.09 | 2.16 | 2.31 | 18.64 | 22.74 | 8.30 |
| 2018 | 1.3 | 0.3 | -2.8 | 2.9 | 5.0 | 1.5 | 1.9 | 2.5 | -0.6 | -8.0 | 3.4 | -6.2 | 0.3 | -3.04 | 9.10 |
Cumulative Growth Since Inception (USD)
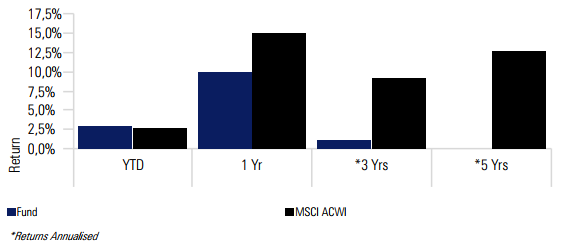
Trailing Returns (USD)
Risk Measures
| Risk Metrics | Fund | MSCI ACWI |
|---|---|---|
| Standard Deviation* | 18.6 | 15.6 |
| Sharpe Ratio* | -0.1 | 0.6 |
| Sortino Ratio* | -0.1 | 1.2 |
*Annualised
Periodic Returns (USD)
| Period | Fund | MSCI ACWI |
|---|---|---|
| 1 Month | -1.5 | -0.6 |
| 3 Months | -0.3 | 0.3 |
| 6 Months | 0.4 | 4.1 |
| YTD | 3.0 | 2.7 |
| 1 Year | 10.0 | 15.1 |
| 3 Years | 1.1 | 9.1 |
| 5 Years | — | 12.8 |
| Since Inception | 1.1 | 12.7 |
Top 10 Holdings
| % | |
|---|---|
| Berkshire Hathaway Inc Class B |
5.7 |
| Opus – Chartered Issuances SA 0% PERP |
5.2 |
| Amazon.com Inc |
2.9 |
| Microsoft Corp |
2.7 |
| Taiwan Semiconductor Manufacturing Co Ltd |
1.9 |
| Apple Inc |
1.9 |
| Alphabet Inc Class A |
1.7 |
| NVIDIA Corp |
1.3 |
| Meta Platforms Inc Class A |
1.3 |
| Mastercard Inc Class A |
1.1 |
Equity Exposure
| % | |
|---|---|
| Financial Services |
20.0 |
| Healthcare | 13.3 |
| Technology |
21.6 |
| Consumer Cyclical |
11.4 |
| Consumer Defensive |
6.1 |
| Communication Services |
6.9 |
| Industrials |
10.0 |
| Energy |
2.4 |
| Basic Materials |
1.8 |
| Utilities |
0.6 |
| Real Estate |
5.9 |
Asset Allocation
Monthly Portfolio Net Returns (USD)
| Jan | Feb | Mar | Apr | May | Jun | Jul | Aug | Sep | Oct | Nov | Dec | YTD | B-Mark | US CPI + 7% | |
|---|---|---|---|---|---|---|---|---|---|---|---|---|---|---|---|
| 2025 | 4.5 | -1.5 | 3.0 | 2.7 | — | ||||||||||
| 2024 | 0.33 | 2.70 | 4.64 | -3.70 | 3.4 | 1.4 | 1.5 | 2.3 | 1.9 | -2.2 | 1.0 | -3.2 | 10.1 | 17.5 | — |
| 2023 | 5.05 | -3.33 | 1.79 | 2.16 | -0.96 | 3.43 | 4.29 | -3.61 | -5.72 | -4.43 | 10.95 | 6.34 | 15.60 | 23.79 | — |
| 2022 | -14.80 | -5.27 | 1.34 | -11.19 | -6.19 | -9.55 | 11.63 | -7.20 | -7.89 | 1.74 | 7.86 | -1.24 | -36.26 | -18.14 | 14.66 |
| 2021 | -0.28 | -1.80 | -2.97 | 6.19 | 0.44 | 3.29 | 1.43 | 1.25 | -2.46 | 3.97 | -2.37 | -0.19 | 6.23 | 21.82 | 13.81 |
| 2020 | 0.46 | -8.58 | -4.23 | 12.04 | 5.45 | 4.91 | 7.64 | 7.67 | -1.78 | -4.09 | 9.79 | 7.60 | 40.61 | 15.90 | 8.30 |
| 2019 | 6.78 | 3.95 | 2.58 | 3.34 | -3.50 | 4.68 | 1.44 | -2.88 | -1.85 | 2.53 | 2.56 | 5.62 | 27.65 | 27.67 | 9.26 |
| 2018 | 6.27 | -3.06 | -1.31 | 2.74 | 3.29 | 1.83 | 0.98 | 2.85 | -0.55 | -9.54 | 3.06 | -5.48 | -0.01 | -8.71 | 8.92 |
Returns are based on the strategic underlying weightings of the funds and will not exactly reflect individual client returns. All returns are net of fund management fees, but exclude advice and administration fees. Prior to portfolio launch date, the performance is pro-forma using the actual underlying fund performances and is net of all fees and expenses.
*The performance information is based on the back-tested performance of hypothetical investments over the time periods indicated. “Back-testing” is a process of objec-tively simulating historical investment returns by applying a set of rules for buying and selling securities, and other assets, backward in time, testing those rules, and hypo-thetically investing in the securities and other assets that are chosen. Back-testing is designed to allow investors to understand and evaluate certain strategies by seeing how they would have performed hypothetically during certain time periods. While back-testing results reflect rigorous application of the investment strategy selected, back-tested results have certain limitations and should not be considered indica-tive of future results. The results achieved in our simulations do not guarantee future investment results.
Sign up to our newsletter!
Keep updated on how best to create wealth and protect it for the future.